EXAM READY ECONOMICS
Aggregate Demand: A-Level Economics: Complete Guide | AQA & Edexcel ( Theme 2)
1. What Is Aggregate Demand?
2. The Four Components of AD
3. The AD Formula Explained
4. Why the AD Curve Slopes Down
5. Shifts vs Movements
6. What Makes AD Shift
7. The Multiplier Effect
8. Government Control of AD
9. Real World Examples
10. AD meets AS
11. Common Exam Mistakes
Imagine the entire UK economy as one massive shopping spree.
Aggregate demand (AD) is the total amount everyone in the country wants to spend in a year. And by everyone, I mean literally everyone – you buying snacks, businesses buying equipment, the government building hospitals, and other countries buying British stuff.
What you have to write in your exams:
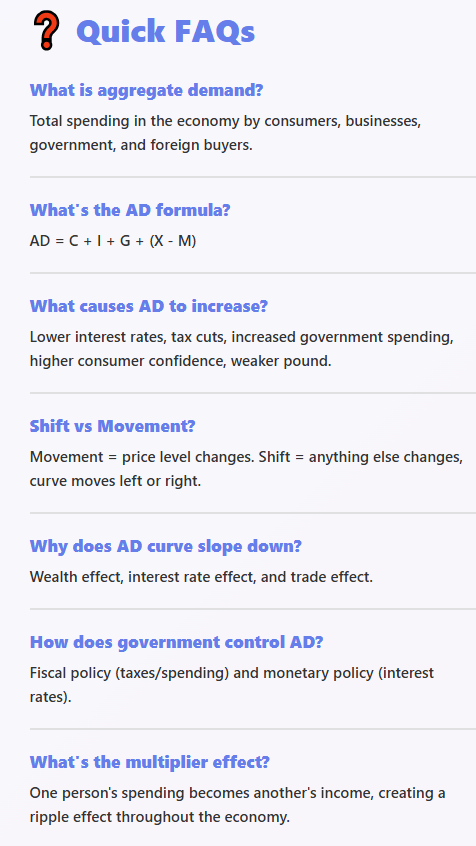
Definition: Aggregate Demand (AD) is the total demand for all goods and services in an economy at a given average price level.
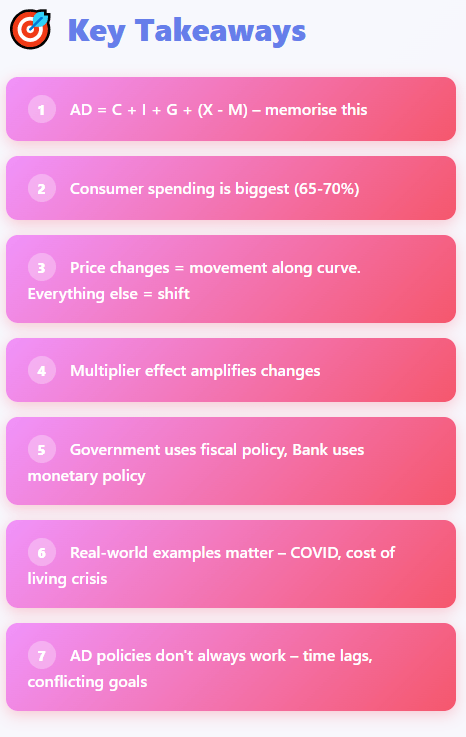
The golden formula you need to memorise: AD = C + I + G + (X - M)
Let's break down who these characters are.
The Four Components (Your New Best Friends)
This is you, your family, everyone you know buying stuff. New football boots, gym membership, hockey sticks, concert tickets, getting your hair done – it all counts.
What makes it go up or down?
Disposable income – money left after taxes
Consumer confidence – are people feeling optimistic or scared?
Interest rates – can you afford that loan for a car?
Wealth effect – when house prices rise, people feel richer and spend more
Real example: During Black Friday 2023, UK shoppers spent £9.42 billion in one weekend. Everyone buying new trainers, sports gear, clothes, tech – that's consumer spending spiking and pushing AD up.
When businesses buy new equipment, build factories, or stock up on inventory. Not your personal investments in crypto or whatever – this is businesses investing in themselves to make more money in the future.
Real example: When Tesla built their Berlin factory in 2022, that was investment spending. Every truck, robot, and building material they bought increased aggregate demand.
What affects it:
Interest rates (borrowing to invest is expensive when rates are high)
Business confidence (will this investment actually make money?)
Technology changes (AI boom = businesses investing in new tech)
Capacity (are factories already full or do we need more?)
Everything the government buys – from teachers' salaries to building hospitals to buying military equipment. Important: this does NOT include transfer payments like benefits (that's just moving money around, not buying stuff).
Real example: During COVID-19, the UK government's furlough scheme cost £70 billion. That money kept aggregate demand from completely crashing when everyone was locked down.
What affects it:
Political priorities (Labour vs Conservative = different spending)
Economic conditions (recession = government usually spends more)
Debt levels (how much can we actually afford?)
Exports (X) = stuff we sell to other countries
Imports (M) = stuff we buy from other countries
Net Exports = X - M
Real example: When the pound got weaker after Brexit, British goods became cheaper for foreigners. More tourists visited London, and UK exports increased, boosting AD. But we also import loads (hello, iPhones and fast fashion), so this is usually negative for the UK – we buy more from abroad than we sell.
What affects it:
Exchange rates (weak pound = exports cheaper, imports expensive)
Foreign income (if US is doing well, they buy more British stuff)
Trade policies (tariffs, Brexit deals, etc.)
Competitiveness (is British stuff actually good quality?)
AD = C + I + G + (X - M)
Think of it like this:
Total spending = Your spending + Business spending + Government spending + (What we sell abroad - What we buy from abroad)
This formula is your best friend in exams. Literally every AD question will use this somehow.
Picture a graph: Price level on the vertical axis, Real GDP (total output) on the horizontal axis. The AD curve slopes downward from left to right. But why?
Three Reasons the AD Curve Slopes Downward :
1. The Wealth Effect
When prices rise, the money in your bank account buys less stuff. You feel poorer, so you spend less. When prices fall, you feel richer and spend more
.
2. The Interest Rate Effect
Higher prices mean people need more money for everyday stuff, so they borrow more. More borrowing = higher interest rates = less spending on big purchases like houses and cars.
3. The International Trade Effect
If UK prices rise but other countries' prices stay the same, British goods become less competitive. Exports fall, imports rise, net exports decrease.
Shifts vs Movements (CRUCIAL for Exams!)
Movement ALONG the curve: Only happens when the price level changes. The curve doesn't move, you just slide up or down it.
Shift OF the curve: Happens when anything OTHER than price level changes (interest rates, consumer confidence, government spending, etc.). The whole curve moves left or right.
Left shift = AD decreases (bad times – less spending at every price level)
Right shift = AD increases (good times – more spending at every price level)
AD Shifts RIGHT (Increases/Outward) When:
Interest rates drop
→ 2020-2021 example: Bank of England cut rates to 0.1% during COVID. Borrowing became super cheap, so people bought houses like crazy. Housing market went absolutely wild.
Consumer confidence rises
→ People feel secure in their jobs and optimistic about the future, so they spend more instead of saving.
Government increases spending
→ 2024 example: Labour government announced £28 billion for green energy infrastructure. That's a massive injection into AD.
Taxes are cut
→ More disposable income = more spending. Liz Truss tried this in 2022 (spoiler: it didn't go well, but the theory was right).
Pound gets weaker
→ British exports become cheaper for foreigners, X increases. Plus imports become more expensive, so M decreases. Net exports improve.
Wealth increases
→ Stock market booms or house prices rise = people feel richer = they spend more (even if they haven't actually sold anything).
AD Shifts LEFT (Decreases/ Inward) When:
Interest rates rise
→ 2022-2023 example: Bank of England raised rates from 0.1% to 5.25% to fight inflation. Mortgage payments skyrocketed. People stopped spending on anything except essentials. Consumer spending (C) and investment (I) both crashed.
Consumer confidence falls
→ 2008 financial crisis: Everyone panicked and stopped spending because they were scared about losing their jobs.
Government cuts spending
→ 2010s austerity: Government slashed spending to reduce debt. Public sector jobs were cut, infrastructure projects were cancelled. AD shifted left hard.
Taxes increase
→ Less disposable income = less spending. Simple as that.
Recession abroad
→ If the EU or US goes into recession, they buy less British stuff. Exports fall, AD decreases.
Here's where it gets spicy. When someone spends money, it doesn't just disappear – it becomes someone else's income, who then spends it again, and again, and again.
Example Story:
Government builds a new school for £10 million.
Construction workers get paid £10 million
They spend 80% of it (£8 million) on food, rent, clothes, entertainment
Shop owners and landlords now have £8 million
They spend 80% of that (£6.4 million) on their own stuff
And so on...
The original £10 million injection creates way more than £10 million of total spending in the economy. That's the multiplier effect.
The Formula:
Multiplier = 1 / (1 - MPC)
MPC = Marginal Propensity to Consume (what % of extra income people spend)
If MPC = 0.8, then Multiplier = 1 / (1 - 0.8) = 1 / 0.2 = 5
So a £10 million government spending increase creates £50 million total increase in AD. Pretty powerful, right?
But here's the catch: The multiplier can work in reverse too. If government cuts spending by £10 million, total AD could fall by £50 million. Yikes.
Think of the government and Bank of England as trying to rizz up the economy. They're constantly adjusting interest rates and spending to keep AD at the perfect level – using their economic charisma to make sure everyone's spending just the right amount. Too desperate (spending too much) = inflation. Too awkward (spending too little) = recession.
The goal? Smooth, balanced economic rizz.
Fiscal Policy (Government's Power Move): This is when the government uses taxes and spending to influence AD.
Expansionary Fiscal Policy (boost AD):
Increase government spending (G↑)
Cut taxes (C↑ because more disposable income)
Use: During recessions to create jobs and growth
Contractionary Fiscal Policy (reduce AD):
Decrease government spending (G↓)
Raise taxes (C↓ because less disposable income)
Use: When inflation is too high
Real example: COVID-19 response was textbook expansionary fiscal policy. Government spent billions on furlough, business grants, NHS support. This kept AD from completely collapsing during lockdowns.
Monetary Policy (Bank of England's Power Move)
This is when the Bank of England uses interest rates and money supply to influence AD.
Expansionary Monetary Policy (boost AD):
Lower interest rates → cheaper borrowing → more C and I
Quantitative easing (printing money) → more money in economy
Contractionary Monetary Policy (reduce AD):
Raise interest rates → expensive borrowing → less C and I
Sell government bonds → take money out of economy
Real example: 2022-2024 inflation crisis. Bank of England raised interest rates 14 times in a row (from 0.1% to 5.25%) to cool down the economy and bring inflation down from 11%. It worked, but it also made mortgages really expensive and slowed economic growth.
The Cost of Living Crisis (2022-2023)
This was basically an AD disaster movie. Here's what happened:
Energy prices skyrocketed after Russia invaded Ukraine (gas prices went crazy)
Inflation hit 11% – highest in 40 years
Bank of England raised interest rates to fight inflation
Result: People had way less disposable income
Consumer spending (C) dropped because everyone was spending all their money on energy bills and food.
Investment (I) fell because businesses were scared and borrowing was expensive. The whole AD curve shifted left – economist speak for "the economy is struggling."
People were literally choosing between heating and eating. That's what happens when AD crashes.
Post-COVID Boom (2021)
The opposite situation. Everyone had been stuck inside for a year, saving money because there was nothing to do. When things reopened:
Pent-up demand exploded
People went crazy booking holidays
Restaurants were packed
Everyone was buying stuff they'd been waiting for
AD shot up so fast it actually caused inflation because businesses couldn't keep up with all the demand. Supply chains were still messed up from COVID, but everyone wanted everything RIGHT NOW.
This is why managing AD is so tricky – too little = recession, too much = inflation.
Current Situation (2024-2025)
As of late 2024/early 2025:
Inflation has come down to around 4%
Interest rates are starting to be cut slowly
Consumer confidence is recovering but still fragile
Government is trying to balance growth with controlling debt
The economy is in that awkward phase of trying to recover without triggering another inflation spike. Classic AD management problems.
AD doesn't work alone. It teams up with Aggregate Supply (AS) – which is the total amount of goods and services that firms are willing to produce at different price levels.
Where AD and AS meet = Equilibrium
This determines two things:
Price level (how expensive stuff is overall)
Real GDP (how much the economy is producing)
The Four Scenarios:
1. High AD + High AS = Economic boom
Lots of spending, lots of production, low unemployment, everyone's happy. But watch out for inflation.
2. Low AD + Low AS = Deep recession
Nobody's spending, firms aren't producing, high unemployment, sad times.
3. High AD + Low AS = Inflation
Everyone wants to buy stuff but there's not enough being produced. Prices skyrocket. This is what happened in 2021-2022.
4. Low AD + High AS = Deflation risk
Firms are producing loads but nobody's buying. Prices might fall, which sounds good but can lead to a deflationary spiral (bad news).
Time Lags
Recognition lag: Takes time to realize there's a problem
Decision lag: Government takes forever to decide what to do
Implementation lag: Policies take time to put into action
Impact lag: Even after implementation, effects take months or years
Example: By the time a tax cut actually boosts spending, the recession might already be over and now you've caused inflation instead. Oops.
Conflicting Objectives
Government wants:
Low inflation
Low unemployment
Economic growth
Balanced budget
But these often conflict! Boosting AD might reduce unemployment but increase inflation. Cutting AD might reduce inflation but increase unemployment.
You can't have it all. That's the Phillips Curve problem (short-run trade-off between inflation and unemployment).
External Shocks
Sometimes stuff happens that's completely outside government control:
Global pandemics (COVID)
Wars (Ukraine)
Oil price shocks
Financial crises
No amount of AD management can fully protect against these.
The Confidence Problem
Fiscal and monetary policy only work if people believe in them. If everyone thinks the economy is doomed, they'll save money regardless of what the government does. Consumer confidence is half the battle.
Mistake 1: Confusing shifts and movements
❌ "Higher prices shift AD to the left"
✅ "Higher prices cause a movement along the AD curve"
Only non-price factors shift the curve!
Mistake 2: Forgetting the formula
Always show AD = C + I + G + (X-M) somewhere in your answer. Easy marks.
Mistake 3: No evaluation
Don't just explain what happens – evaluate WHY it might not work, time lags, side effects, assumptions.
Mistake 4: Weak examples
❌ "Consumer spending might increase"
✅ "Consumer spending increased by £X billion during Black Friday 2023 when..."
Specific examples = better marks.
Mistake 5: Ignoring diagrams
Draw the AD/AS diagram even if they don't explicitly ask for it. Label everything. Show the shifts with arrows. Easy marks.
Mistake 6: Forgetting about transfer payments
Benefits, pensions, and unemployment payments are NOT part of G in the AD formula. They're just moving money around, not government buying stuff.
Mistake 7: Mixing up monetary and fiscal policy
Fiscal = government taxes and spending
Monetary = Bank of England interest rates
Don't mix them up!
Aggregate demand is basically the economic way of saying "how much is everyone trying to spend right now?" And that number decides whether we're in a boom, bust, or somewhere in between.
The government and Bank of England are constantly trying to hit that Goldilocks zone – not too hot (inflation), not too cold (recession), but just right.
Sometimes they nail it, sometimes they don't, but understanding AD is the key to understanding why your parents complain about interest rates, why everything got so expensive in 2022, and why economic policy is way more complicated than it looks.
Master this and you're well on your way to acing this topic.
💬 Question for you:
Which component of aggregate demand do you think matters most right now and why?
Join the conversation and comment below

Bubli -A Level Economics Tutor
I help my students stress less, score more, and enjoy Economics with real-life examples that click instantly.
Follow for more content updates
Free: The Revision Tracker 1000+ Students Are Using Right Now🡻
👉 including full-topic notes, model essays, essay structure, definition list, formula list, active recall quizzes, Essay Markings, and exclusive A* resources updated every week.
Click the button below to explore more and unlock the tools top students use to get ahead.

Bubli- A Level Economics Tutor
EXAM READY ECONOMICS
address: Kingfisher House, B3 Kingsway N, Gateshead NE11 0JQ
© 2025 ExamReadyEconomics